Monday, August 1, 2022

REU Project: Integrating Serverless and Task Computation in Work Queue

David Simonetti, a junior undergraduate at Notre Dame, recently completed a summer REU project in which he added "serverless" computing capabilities to the Work Queue distributed computing framework.

Work Queue has historically used a "task" abstraction in which a complete program with its input files is submitted for remote execution.  David added a capability in which a coprocessor is attached to each worker, providing a hot function execution environment.  Then, lightweight tasks representing single function executions can be sent throughout the distributed system, making use of the existing scheduling, resource management, and data movement capabilities of Work Queue.

This allows for the integrated execution of both conventional whole-process tasks and lightweight functions within the same framework.  Check out the full poster here:


Friday, July 22, 2022

CCTools version 7.4.9 released

 The Cooperative Computing Lab is pleased to announce the release of version 7.4.9 of the Cooperative Computing Tools including Parrot, Chirp, JX, Makeflow, WorkQueue, and other software.

The software may be downloaded here:
http://ccl.cse.nd.edu/software/download

This is a bug fix release:

  • [General] Update binary build to OSX-11. (Ben Tovar)
  • [General] Several updates to JX documentation. (Douglas Thain)
  • [Work Queue] Fix bug where some old files where not deleted from worker's cache. (Ben Tovar)
  • [Work Queue] Fix warning message for required size of workers. (Ben Tovar)
  • [Work Queue] Add transfers size information to transactions log. (Guanchao Huang)


Thanks goes to the contributors for many features, bug fixes, and tests:

  • Andrew Hennessee
  • Guanchao Huang
  • Kelci Mohrman
  • Thanh Son Phung
  • David Simonetti
  • Barry Sly-Delgado
  • Douglas Thain
  • Ben Tovar


Please send any feedback to the CCTools discussion mailing list:

http://ccl.cse.nd.edu/community/forum

Enjoy!

Thursday, June 9, 2022

How Many Eggs Can You Fit In One Nest?

Prof. Thain gave a talk at HTCondor Week 2022, giving an overview of some of our recent work on resource management in high throughput scientific workflows.  An HTCondor talk requires a "bird" metaphor, so I proposed the following question:

How many eggs can you fit in one nest?


A modern cluster is composed of large machines that may have hundreds of cores each, along with memory, disk, and perhaps other co-processors.  While it is possible to write a single application to use the entire node, it is more common to pack multiple applications into a single node, so as to maximize the overall throughput of the system.

We design and build frameworks like Work Queue that allow end users to construct high throughput workflows consisting of large numbers of tasks:

But, how does the end user (or the system) figure out what resources are needed by each task?  The end user might have some guess at the cores and memory needed by a single task, but these values can change dramatically when the parameters of the application are changed.  Here is an example of a computational chemistry application that shows highly variable resource consumption:

CCL grad student Thanh Son Phung came up with a technique that dynamically divides the tasks into "small" and "large" allocation buckets, allowing us to automatically allocate memory and pack tasks without any input or assistance from the user:

Here is a different approach that we use in a high energy physics data analysis application, in which a dataset can be split up into tasks of variable size.  Instead of taking the tasks as they are, we can resize them dynamically in order to achieve a specific resource consumption:

Ben Tovar, a research software engineer in the CCL, devised a technique for modelling the expected resource consumption of each task, and then dynamically adjusting the task size in order to hit a resource target:

To learn more, read some of our research research papers:

Monday, February 7, 2022

IPDPS Paper: Dynamic Task Shaping ... in High Energy Physics

In an upcoming paper to be presented at IPDPS 2022, we discuss our experience with designing and executing high throughput data intensive applications for high energy physics.  The application itself is pretty cool: TopEFT is a physics application that uses the Coffea framework for parallelization, the Work Queue framework for distributed execution, and XRootD for remote data access:


Configuring such applications to run on large clusters is a substantial end-user problem.  It's not enough to write a correct application: one must also select a wide variety of performance parameters, like the data chunk size, the task length, the amount of memory per task, and so on.  When these are chosen well, everything runs smoothly.  But even one parameter out of tune can result in the application taking orders of magnitude longer than necessary, wasting thousands of resources resources, or simply not running at all.  Here is the end-to-end runtime for a few configurations with slight variations:

This paper describes the techniques that we have developed to make TopEFT a self-configuration application: dynamic task sizing, resource monitoring, modeling of resource consumption, and more.   A particular challenge is that the tasks are not identical, but they do exhibit some rough linearity:

With these techniques, we are able to relieve the user of the burden of setting a variety of controls, and allow the system to find its own stable configuration.  Check it out:


Scaling Up Julia: Hidden Filesystem Stress

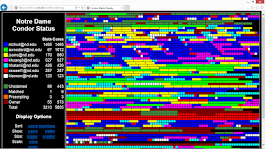
HTCondor Cluster View
In the CCL, we study the design and implementation of scalable systems and applications that run on very large computing systems.  It is not unusual for us to encounter an application that runs well on a few nodes, but causes trouble when running on thousands of nodes.  This happened recently with a simulation written in Julia that was using HTCondor to run millions of tasks running on several thousands nodes on our campus cluster.  It ran fine on one node, but when deployed to thousand nodes, this simulation would cause a total meltdown of the shared filesystem, even though its I/O needs were relatively small.  What was going on?

Here is what we found:

The Julia programming language uses a just-in-time compiler to generate efficient machine code before execution. Julia organizes code in modules, and user applications in projects, where a project is a list of modules. By default, the compilation step is performed every single time an application is executed and considers all the modules listed in the given project.  If an end user sets up an application in the normal way, the result is that the code will be compiled simultaneously on all nodes of the system!

Internally, Julia checks the project's list of modules, checks for files with a modification time more recent than the machine code already available, and if needed, generates new machine code.  As usual, the modifications times are done using the stat() system call. To give some perspective, the simulation used a dozen standard Julia modules, resulting in 12,000 stat() calls  even when no recompilation was needed. But the number of open() calls to needed files was less than 10. In particular, the file that listed the modules in the project (Project.toml) had close to 2,000 stat() calls, but only one open() call. For comparison, the number of calls to open() and stat() for data files particular to the application was less than 5.

When executed in a single machine on a local file system, even a few thousand system calls may unnoticed by the user. However, they become a big problem when trying to run at scale in a cluster where all nodes share a common networked filesystem. If one thousand nodes start at once, the shared filesystem must field twelve million stat() operations just to determine that nothing has changed.  Thus, the scale at which the simulation can run will be limited by factors hidden to the end user, that is, not by the cores, memory, or disk available, but by these file system operations that become expensive when moving from a local to a shared setting.

Once the problem is understood, the workaround is to pre-compile a binary image with the needed modules that then is shipped together with each task.  This reduced the number of stat() calls from the original 12,000 to about 200 per invocation.  This is image is shipped compressed with each job, to reduce its size from 250MB to 50MB, and decompressed just before the task start execution.  Generating the binary image takes about 5 minutes, prior to job submission.

The user application made the generation of the binary image much easier because all the dependencies were listed in a single file. As an example, consider this file that simply lists some modules:

# my_modules.jl
using Pkg
using Random
using Distributions
using DataFrames
using DataStructures
using StatsBase
using LinearAlgebra
If we count the number system calls that involve filenames, we get:

$ strace -f -e trace=%%file julia my_modules.jl |& grep  -E '(stat|open)'| wc -l
5106


These calls will be repeated everytime the program runs. Using the module PackageCompiler we can generate a Julia system image as follows:

# comp.jl

# run as: julia comp.jl
loaded_by_julia = filter((x) -> typeof(eval(x)) <:  Module && x ≠ :Main, names(Main,imported=true));

include("my_modules.jl")

loaded_all = filter((x) -> typeof(eval(x)) <:  Module && x ≠ :Main, names(Main,imported=true));
loaded_by_ch = setdiff(loaded_all, loaded_by_julia);

println("Creating system image with:");
println(loaded_by_ch);

using PackageCompiler;
create_sysimage(loaded_by_ch; sysimage_path="sysimage.so", cpu_target="generic")

Using the image, the number of file releated calls, and there the stress on the
share file system,  are greatly reduced:

$ strace -f -e trace=%file julia -Jsysimage my_modules.jl |& grep -E '(stat|open)' | wc -l
353


Also, as expected, the overhead per run also decreases, as the runtime decreases from about 10s to about 0.5s, which is significant for short running tasks.

So what's the moral of the story?

1 - When moving from a single node to a distributed system, operations that were previously cheap may become more expensive.  You can't fix what you can't measure, so use tools like strace to understand the system-call impact of your application.

2 - Avoid exponential behavior, even when individual costs are cheap.  Every Julia import results in checking the freshness of that module, and then all of its dependencies recursively, and so leaf modules get visited over and over again.  The Julia compiler needs to memoize those visits!


Friday, December 10, 2021

Tuning High Throughput Task Dispatch in Coffea

Consider a distributed application that looks like this: the manager creates an arbitrary number of tasks initially, new tasks are created as tasks complete, and the manager must perform a time consuming accumulation step whenever a task returns. This style of program is common when using the Work Queue framework, and is used extensively by the Coffea data analysis framework for high energy physics.

Here is the problem: if the accumulation of results in complex, it may block the manager from sending tasks, receiving tasks, or performing other operations. In the case where tasks finish spaced out in time, the manager has the ability to post process the task and send a new one to the worker, resulting in minimal performance loss. The problem occurs when multiple workers finish tasks at similar times. The first worker to return its task goes idle and waits to receive another task, however, because the manager is busy with its accumulation step the worker can not receive a new task. As other workers finish, they also become idle as the manager remains busy and can not receive tasks or issue tasks to any of the returned/idle workers.

One solution to this problem is to create an altered version of the inner logic of the work_queue_wait loop. The current version of work_queue_wait works roughly as follows: First, the manager polls all the current tasks to see if any have been retrieved, and if this is the case the manager breaks out of the loop and returns the completed task. Otherwise, the manager continuously attempts to receive a task from any worker, send a task to a worker that can receive one, and perform other operations like looking to connect more workers. This continues until the manager times out or successfully retrieves a task and breaks out of the work_queue_wait to return it.

The alteration is a relatively small change. Instead of the current version of the loop where the work_queue_wait breaks out as soon as a task is retrieved, the program continues looping through work_queue_wait as long as either a task is retrieved, a task is sent out, or both. Once both a task is not retrieved and not sent, the work_queue_wait loop is exited with the first task to be retrieved. The advantage of this is that if multiple workers are waiting for a task, they will all be given work to do before the work_queue_wait loop exits and the manager begins accumulating a task. The feature is enabled by calling work_queue_tune(q, "wait_retrieve_many", 1)

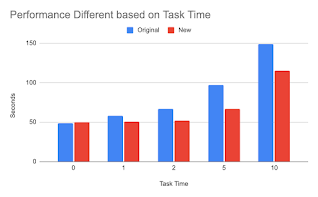
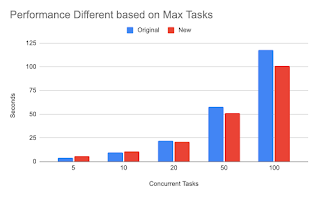
The charts below show a synthetic performance benchmark of this new altered work_queue_wait loop. The benchmark was performed by creating a program that has four parameters. The max tasks parameter determines the total number of tasks to be ran, the concurrent tasks parameter determines how many workers can be working on tasks at any time, the task time parameter sets how long each task should take, and the post process time defines the time the manager must perform post processing every time a task returns. Each chart is formed off a base of 100 max tasks, 5 concurrent tasks, 1 second task time, and a 1 second post process time. There are four charts below, each varying one of the four variables to see its effect on total workload time.

Overall, it appears that tasks which take longer to complete as well as having more of said tasks creates a larger performance gain with the new wait_retrieve_many option. Tasks that require a significant amount of post processing do not benefit much from wait_retrieve_many because they are still mostly bound by the total amount of post processing required.


Applying wait_retrieve_many to Coffea also has promising results. As seen below, in a 4 trial run of the example Coffea program run using the work_queue executor takes about 60 seconds to complete on 10 workers. Enabling the wait_receive_many feature results in a 20% improvement in execution time for the entire application. This feature is now enabled by default in the WQ executor for Coffea.


- David Simonetti, undergraduate student in the CCL

Scalable Molecular Dynamics with Work Queue at UT-Austin

The Biomolecular Engineering Lab at UT-Austin routinely requires large scale molecular dynamics for predicting ligand-protein binding affinity.  The lab makes use of the Cooperative Computing Tools to build and run a variety of distributed applications on their 124 node, 75 GPU cluster.  Custom Work Queue applications are run on the cluster for months at a time to generate large amounts of ab-initio data to parameterize the AMOEBA model for small molecules, and perform single-point computations via Poltype 2.  In addition, the lab makes use of the ForceBalance application built on Work Queue for liquid property fitting for Van der Waals parameter refinement.


Friday, November 5, 2021

JX Language: REPL Tool and Dot Operator

Undergraduate student Jack Rundle has been making improvements to the JX language used throughout the CCTools package for expressing workflows, database queries, and other structured information.


First, we added a new command line tool, jx_repl, which provides an interactive REPL environment to work with the JX language:


In addition to standard JX evaluation, the tool also reserves a number of symbols in the context, acting as commands when entered (ex: "help", "quit", etc.).  A full guide for the REPL is outlined in the CCTools documentation.  One interesting feature is that both the input expression and output for each line are stored throughout the program's life-cycle.  Previous input expressions can be referenced via "in_#" and the associated output via "out_#".  Furthermore, JX will resolve symbols in the input expressions, which themselves may include references to "out_#". 

Next, we provide support for a new operator in JX: the “dot” operator, which resembles anaphoric macros in Lisp.  The dot operator can be placed after an expression (A) and before a function (B), then JX will evaluate the operator by inserting the expression as the first parameter of the function (B(A)).  In cases of functions with multiple parameters, the other parameters simply get shifted over.  For example:

BEFORE: len([1,2,3,4]) # 4
AFTER: [1,2,3,4].len() # 4

BEFORE: like("abc", "a.+") # true
AFTER: "abc".like("a.+") # true

BEFORE: format("ceil(%f) -> %d", 9.1, 10) # "ceil(9.1) -> 10"
AFTER: "ceil(%f) -> %d".format(9.1, 10) # "ceil(9.1) -> 10"

BEFORE: len(project(select([{"a": 1}, {"a": 2}], a>0), a)) # 2
AFTER: [{"a": 1}, {"a": 2}].select(a>0).project(a).len() # 2
 

In order to make this work, we did have to swap the parameter order for three different functions: project(), select(), and like().  However, we can now query the global catalog server with database like queries:

fetch("http://catalog.cse.nd.edu:9097/query.json").select(type=="wq_master").project([name,tasks_total_cores])

Yields:

[
    ["earth.crc.nd.edu",7373],
    ["hallofa.ps.uci.edu",15],
    ["hpc-services1.oit.uci.edu",2],
    ["vm65-195.iplantcollaborative.org",1460],
    ...
]


Thursday, November 4, 2021

PONCHO Toolkit for Portable Python


PONCHO, is a lightweight Python based toolkit which allows users to synthesize environments from a concise, human-readable JSON file containing the necessary information required to build a self-contained Conda virtual environment needed to execute scientific applications on distributed systems. Poncho is composed of three parts: poncho_package_analyze, poncho_package_create and poncho_package_run

poncho_package_analyze performs a static analysis of dependencies used within a python application. The output is JSON file listing the dependencies.

poncho_package_analyze application.py spec.json

This will give you a dependency file like this:

{

"conda":{

"channels":[

"defaults",

"conda-forge"

],

"packages":[

"ndcctools=7.3.0",

"parsl=1.1.0",

]

},

"pip": [

"topcoffea"

]

}


Then if needed, you can manually add other kinds of code and data dependencies like this:

{

"git": {

       "DATA_DIR": {

           "remote": "http://.../repo.git"

       }

},

    "http": {

"REFERENCE_DB": {

"type": "file",

"url": "https://.../example.dat"

}

}

}

poncho_package_create allows users to create an environment from a JSON specification file. This specification may include Conda packages, Pip packages, remote Git repos and arbitrary files accessible via HTTPS.  This environment is then packaged into a tarball.

poncho_package_create spec.json env.tar.gz

poncho_package_run will unpack and and activate the an environment. As an input, a command will then be executed within this environment. Any Git repos or files specified within the environment will be set as environment variables. 

poncho_package_run -e env.tar.gz python application.py  

This programmable interface allows us to now take a Python application and easily move it from place to place within a cluster, and is in production with the Coffea data analysis application and the Parsl workflow system when using Work Queue as an execution system.

The poncho tools can be found in the latest release of the Cooperative Computing Tools.


WORKS Paper: Adaptive Resource Allocation for Heterogeneous Tasks in Dynamic Workflows

CCL graduate student Thanh Son Phung will be presenting his recent work on managing dynamic tasks at the WORKS workshop at Supercomputing 2021:

Dynamic workflows are emerging as the preferable class of workflow management systems due to their offerings of flexibility, convenience, and performance to users. They allow users to generate tasks automatically and programmatically at run time, abstract away the gory implementation details, and retain the intrinsic benefit of parallelism from underlying distributed systems. The below figure shows the full picture of the transitions from logical task generations to actual task deployments and executions in the Colmena-XTB workflow.

However, from a systems developer's standpoint, the dynamic nature of task generation poses a significant problem in term of resource management. That is, what quantity of resources should we allocate for a newly generated task? Figure below shows the memory consumption of tasks over time in the Colmena-XTB workflow.

As demonstrated, tasks vary significantly in their memory consumption (from 2GBs to 30GBs). A large allocation will decrease the probability of task failure due to under-allocation, but increase the potential waste of resource as tasks may only consume a small portion of it. On the other hand, a small allocation has the opposite effects.

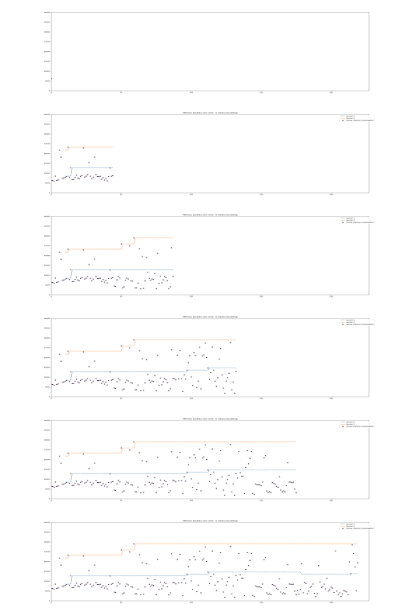
We observe that task allocation can be automated and improved considerably by grouping tasks with similar consumption. A task scheduler can use this information of completed tasks to allocate ready tasks. Figure below visually shows our strategy in task allocation, where each task is first allocated with the value of the blue line, and upon failure due to under-allocation, is allocated with the value of the upper line.

We evaluated our strategies on seven datasets of resource consumption and noticed the substantial improvement of resource allocation efficiency. In details, the average task consumption efficiency under our allocation strategies can range anywhere from 16.1% to 93.9% with the mean of 62.1%.

Read the full paper here:

Thanh Son Phung, Logan Ward, Kyle Chard, and Douglas Thain, Not All Tasks Are Created Equal: Adaptive Resource Allocation for Heterogeneous Tasks in Dynamic WorkflowsWORKS Workshop on Workflows at Supercomputing, November, 2021.