Monday, November 11, 2024
Accelerating Function-Centric Applications via Reusable Function Context in Workflow Systems
Modern applications are increasingly being written in high-level programming languages (e.g., Python) via popular parallel frameworks (e.g., Parsl, TaskVine, Ray) as they help users quickly translate an experiment or idea into working code that is easily executable and parallelizable on HPC clusters or supercomputers. Figure 1 shows the typical software stack of these frameworks, where users wrap computations into functions, which are sent to and managed by a parallel library as a DAG of tasks, and these tasks eventually are scheduled by an execution engine to execute on a remote worker node.
A traditional way to execute functions remotely is to translate them into executable tasks by serializing functions and their associated arguments into input files, such that these functions and arguments are later reconstructed on remote nodes for execution. While this way fits function-centric applications naturally into well understood task-based workflow systems, it brings a hefty penalty to short-running functions. A function now takes extra time for its states to be sent and reconstructed on a remote node which are then unnecessarily destroyed at the end of that function’s execution.
At HPDC 2024, graduate students Thanh Son Phung and Colin Thomas proposed the idea that function contexts, or states, should be decoupled from function’s actual execution code. This removes the overhead of repeatedly sending and reconstructing a function’s state for execution, and allows functions of the same type to share the same context. The rest of the work then addresses how a workflow system can treat a function as a first-class citizen by discovering, distributing, and retaining such context from a function. Figure below shows the execution time of the Large-Scale Neural Network Inference application, totaling 1.6 million inferences separated into 100k tasks, with increasing levels of context sharing (L1 is no sharing, L3 is maximum sharing). Decoupling the inference function’s context from the inference massively reduces the execution time of the entire workflow by 94.5%, from around 2 hours to approximately 7 minutes.
An interested reader can find more details about this work in the paper:Thanh Son Phung, Colin Thomas, Logan Ward, Kyle Chard, and Douglas Thain. 2024. Accelerating Function-Centric Applications by Discovering, Distributing, and Retaining Reusable Context in Workflow Systems. In Proceedings of the 33rd International Symposium on High-Performance Parallel and Distributed Computing (HPDC '24). Association for Computing Machinery, New York, NY, USA, 122–134. https://doi.org/10.1145/3625549.3658663
Monday, November 4, 2024
A New Visualization Tool for TaskVine Released
We released a web-based tool to visualize runtime logs produced by TaskVine, available on Github. Using this tool involves two main steps. First, the required data in CSV format must be generated for the manager, workers, tasks, and input/output files. After saving the generated data in the directory, users can start a port on their workstation to view detailed information about the run. This approach offers two key advantages: the generated data can be reused multiple times, minimizing the overhead of regeneration, and users can also develop custom code to analyze the structured data and extract relevant insights.
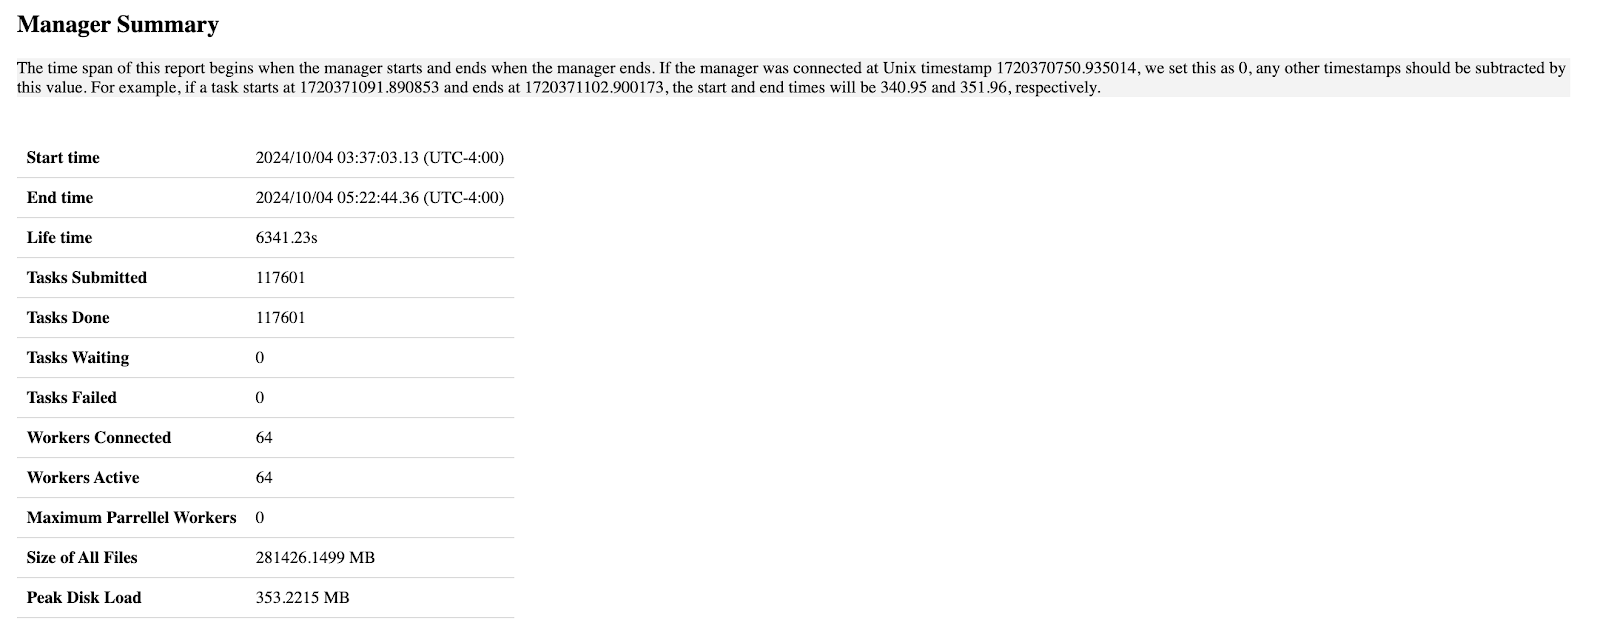
For example, the first section describes the general information of this run, including the start/end time of the manager, how many tasks are submitted, how many of them succeeded or failed, etc.
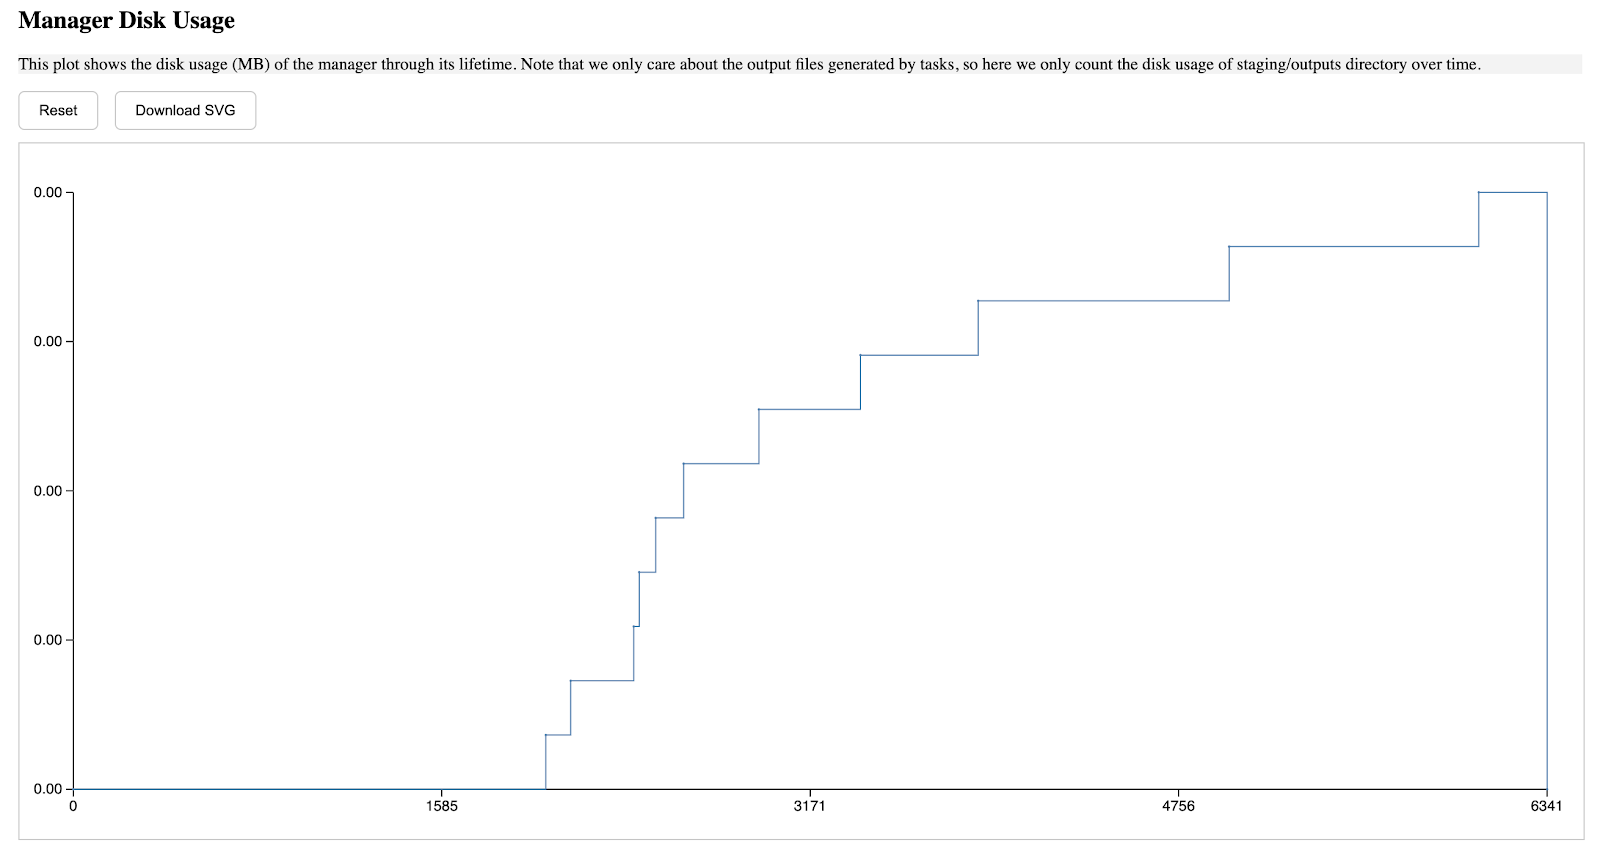
The second section describes the manager's storage usage through its lifetime, the a-axis starts from when the manager is started, and ends when the manager is terminated, the y-axis is in MB unit, and such pattern is applied to all diagrams in this report.
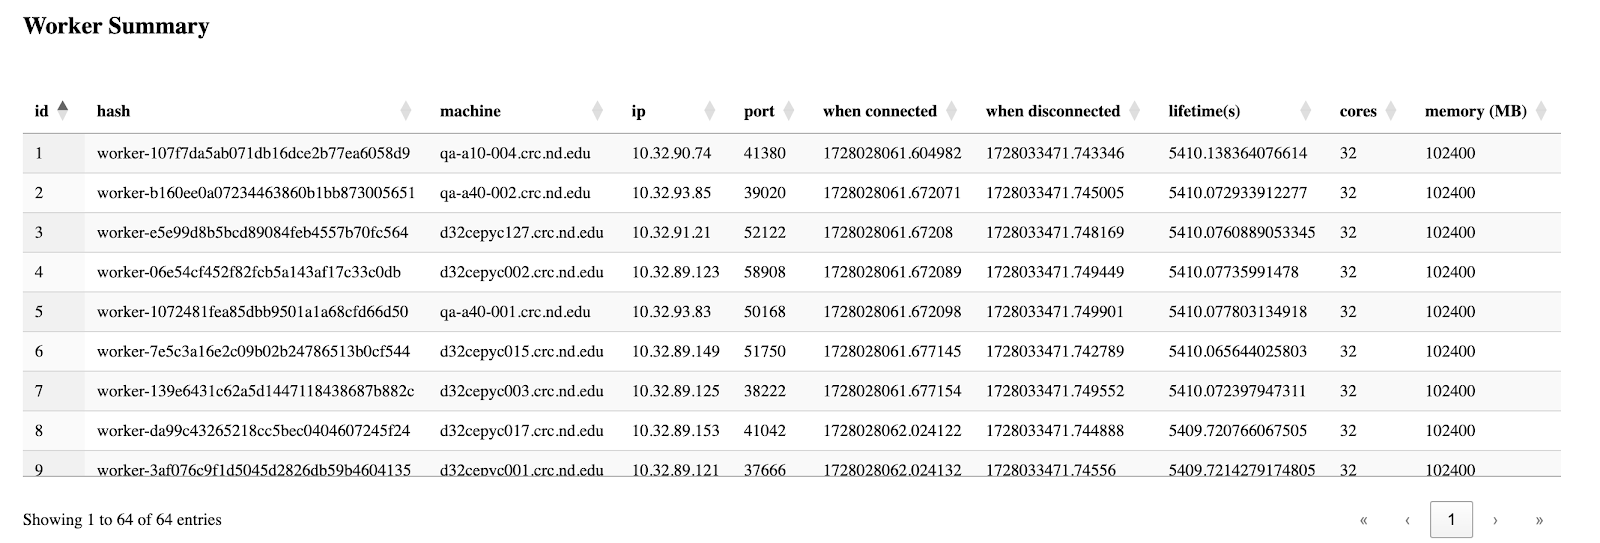
The third section is the table of all workers' information, which is basically grabbed from the csv files from the backend, but this enables users to easily sort by their interested columns.
The fourth section is the storage consumption among all workers. Several buttons in the top are provided, to turn the y-axis to a percentage unit, or to highlight one worker that is of interest.
The fifth section is the number of connected workers throughout the manager's lifetime, hovering the mouse on a point shows the information of a connected/disconnected worker.
The sixth section shows the number of concurrent workers throughout the manager's lifetime.
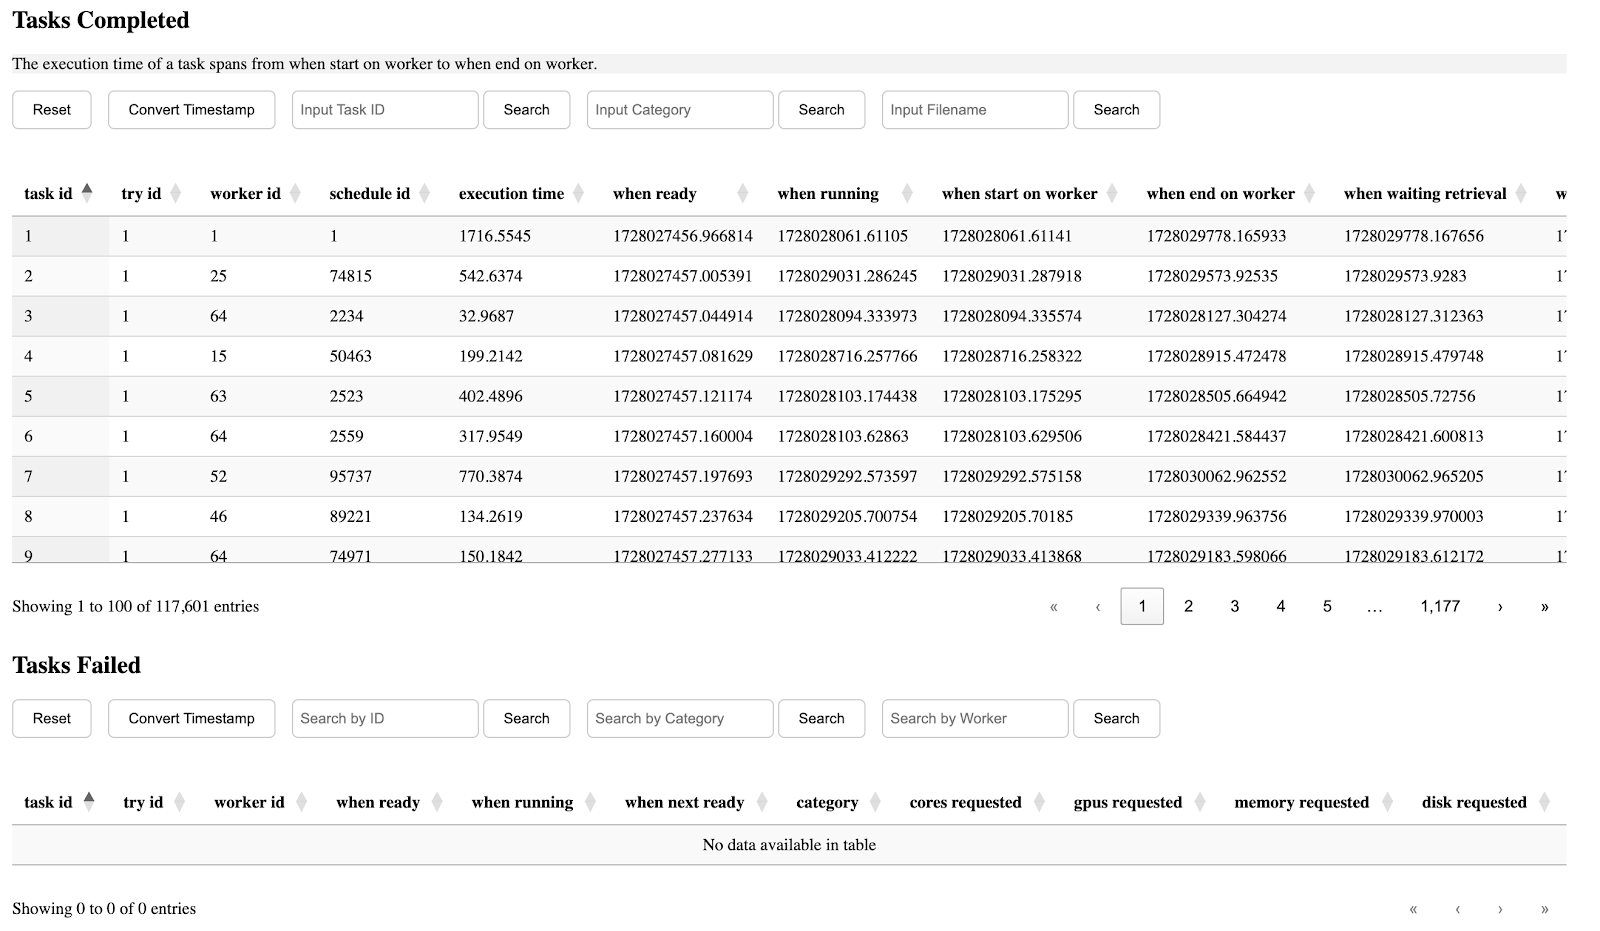
The seventh section is table of completed/failed tasks and their information.
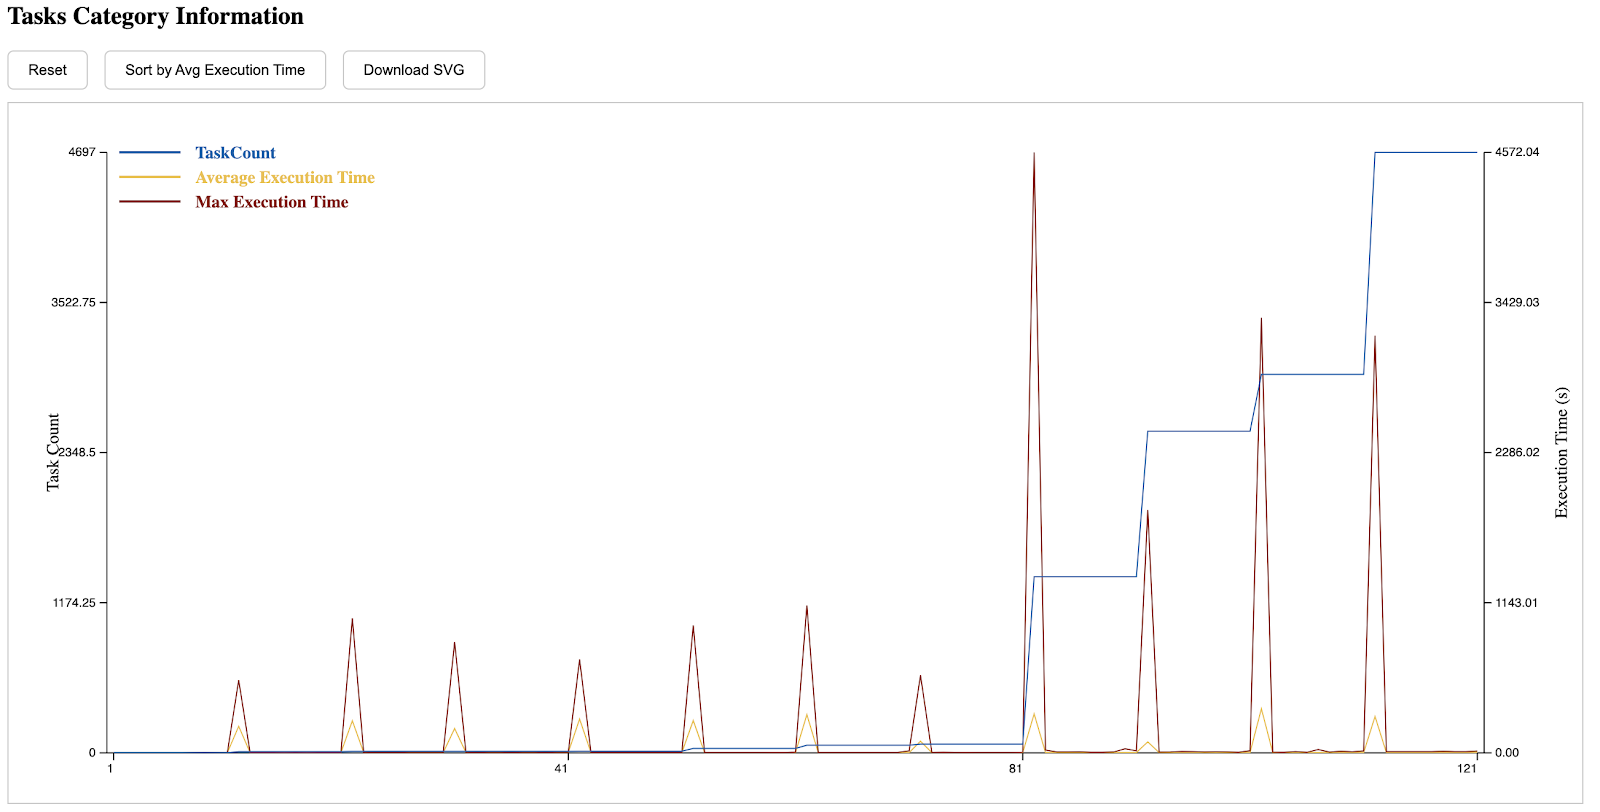
The eighth section is the execution time distribution of different tasks. Those with a lower index on the left side of the x-axis are submitted earlier, while those on the right are submitted later. A CDF can be seen by clicking the button on the top.
The tenth section demonstrates the general runtime distribution of tasks, the y-axis is the worker-slot pair. In the following example, we have 64 workers and each with 20 cores. One can zoom in the diagram and hover to see the detailed information of one task, which is particularly useful when examining outliers.
The last section is about the structure of the compute graphs. Nodes in the graph are tasks with an index label, while edges are the dependencies between input/output files of tasks. Weights on those task->file edges are the execution time of tasks, while those on the file->task edges are the waiting time starting from when a file is produced to when it is consumed by a consumer task.
This tool works well under the scale of hundreds of thousands of tasks, but for large runs, which may have millions of tasks, the online visualization tool may be unable to process such amount of data because the data transferring bottleneck between backend and frontend. Under such case, or just for convenience, we recommend the users to use tools under the pyplot directory, which is more lightweight and uses traditional matplotlib and seaborn to draw diagrams. Detailed explanations are provided under the README file.