Showing posts with label condor. Show all posts

Friday, August 14, 2015

CMS Analysis on 10K Cores Using Lobster

We have been working closely with the CMS physics group at Notre Dame for the last year to build Lobster, a data analysis system that runs on O(10K) cores to process data produced by the CMS experiment at the LHC.  At peak, Lobster at ND delivers capacity equal to that of a dedicated CMS Tier-2 facility!

Existing data analysis systems for CMS generally require that the user be running in a cluster that has been set up just so for the purpose: exactly the right operating system, certain software installed, various user identities present, and so on. This is fine for the various clusters dedicated to the CMS experiment, but it leaves unused the enormous amount of computing power that can be found at university computing centers (like the ND CRC), national computing resources (like XSEDE or the Open Science Grid), and public cloud systems.

Lobster is designed to harness clusters that are not dedicated to CMS.  This requires solving two problems:
  1. The required software and data are not available on every node.  Instead, Lobster must bring them in at runtime and create the necessary execution system on the fly.
  2. A given machine may only be available for a short interval of time before it is taken away and assigned to another user, so Lobster must be efficient at getting things set up, and handy at dealing with disconnections and failures.
To do this, we build upon a variety of technologies for distributed computing.  Lobster uses Work Queue to dispatch tasks to thousands of machines, Parrot with CVMFS to deliver the complex software stack from CERN, XRootD to deliver the LHC data, and Chirp and Hadoop to manage the output data.

Lobster runs effectively on O(10K) cores so far, depending on the CPU/IO ratio of the jobs.  These two graphs show the behavior of a production run on top of HTCondor at Notre Dame hitting up to 10K cores over the course of a 48-hour run.  The top graph shows the number of tasks running simultaneously, while the bottom shows the number of tasks completed or failed in each 10-minute interval.  Note that about two thirds of the way through, there is a big hiccup, due to an external network outages.  Lobster accepts the failures and keeps on going.

Lobster has been a team effort between Physics, Computer Science, and the Center for Research Computing: Anna Woodard and Matthias Wolf have taken the lead in developing the core software; Ben Tovar, Patrick Donnelly, and Peter Ivie have improved and debugged Work Queue, Parrot, and Chirp along the way; Charles Mueller, Nil Valls, Kenyi Anampa, and Paul Brenner have all worked to deploy the system at scale in production; Kevin Lannon, Michael Hildreth, and Douglas Thain provide the project leadership.
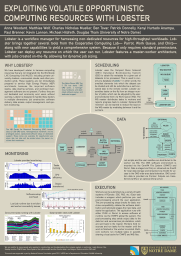

Anna Woodard, Matthias Wolf, Charles Nicholas Mueller, Ben Tovar, Patrick Donnelly, Kenyi Hurtado Anampa, Paul Brenner, Kevin Lannon, and Michael Hildreth, Exploiting Volatile Opportunistic Computing Resources with Lobster, Computing in High Energy Physics, January, 2015.

Anna Woodard, Matthias Wolf, Charles Mueller, Nil Valls, Ben Tovar, Patrick Donnelly, Peter Ivie, Kenyi Hurtado Anampa, Paul Brenner, Douglas Thain, Kevin Lannon and Michael Hildreth, Scaling Data Intensive Physics Applications to 10k Cores on Non-Dedicated Clusters with Lobster, IEEE Conference on Cluster Computing, September, 2015.

Friday, February 14, 2014

Visualizing 10,000 Cores in Condor

Our Condor pool at the University of Notre Dame has been slowly growing, in no small part due to our collaboration with the Center for Research Computing, where it is now scavenging unused cycles from HPC clusters at the CRC.  When the dedicated batch system leaves a node unused, Condor is started on that node and keeps going until the dedicated system wants the node back.  Depending on the time of year, that leaves anywhere between 4K and 10K nodes available in the Condor pool.

We have tried a number of approaches at visualizing this complex system over the years.  Our latest tool, the Condor Matrix Display started as a summer project by Nick Jaeger, a student from the University of Wisconsin at Eau Claire.  The display shows a colored bar for each slot in the pool, where the width is proportional to the number of cores.

With a quick glance, you can see how many users are busy and whether they are running "thin" (1 core) or "fat" (many core) jobs.  Sorting by the machine name gives you sense of how each sub-cluster in the pool is used:


While sorting by users gives you a sense of what users are dominating the pool:


The display is always a nice way of viewing the relatively new feature of "dynamic slot" in Condor.  A large multi-core machine is now represented as a single slot with multiple resources.  For example, this bit of the display shows a cluster of 8-core machines where some of the machines are unclaimed (green), some are running 4-core jobs (blue), and some are running 1-core jobs (green):


Monday, November 8, 2010

Sometimes It All Comes Together

Most days, software engineering involves compromises and imperfect solutions. It's rare for two pieces of software to mesh perfectly -- you always have to work to overcome the limitations or assumptions present in different modules. But, every once in a while, the pieces just come together in a satisfying way.

A few weeks back, we ran into a problem with BXGrid, our system for managing biometric data. Our users had just ingested a whole pile of new images and videos, and were browsing and validating the data. Because data was recently ingested, no thumbnails had been generated yet, so every screenful required a hundred or so thumbnails to be created from the high resolution images. Multiple that by each active user, and you have a web site stuck in the mud.

A better solution would be to generate all of the missing thumbnails offline in an orderly way. Since many of the transcoding operations are compute intensive, it makes sense to farm them out to a distributed system.

Peter Bui -- a graduate student in our group -- solved this problem elegantly by putting together almost all of our research software simultaneously. He used Weaver as the front-end language to query BXGrid and determine what thumbnails needed to be generated. Weaver generated a Makeflow to perform all of the transcodings. Makeflow used Work Queue to execute the tasks, with the Workers submitted to our campus Condor pool.

So far, so good. But, the missing piece was that Makeflow expects data to be available as ordinary files. At the time, this would have required that we copy several terabytes out of the archive onto the local disk, which wasn't practical. So, Peter wrote a module for Parrot which enabled access to BXGrid files under paths like /bxgrid/fileid/123. Then, while attached to Parrot, Makeflow could access the files, being none the wiser that they were actually located in a distributed system.

Put it all together, and you have this:

Sometimes, it all comes together.

Monday, April 5, 2010

The Forty Tribes of Linux

As I have noted in this column before, a perennial challenge of distributed computing in the real world is dealing with the multiplicity of operating systems and related environments. If you are dealing with an uncontrolled environment like a large university or an 'at home' computing environment, there is no telling what you are going to get. If you have a piece of software that depends exactly on the presence of Linux 19.5.3.4.9.2, it just isn't going to work.

You might think that this could be avoided by having a professionally managed environment. At Notre Dame, we have a site license for Red Hat Linux, and our staff are pretty rigorous in keeping everything up to date and on track. But even then, you can't assume everything is identical: there is no way to upgrade everyone simultaneously, and every machine operates on a different schedule (and discipline) for picking up automatic updates. For example, we are currently in the tail of of a general campus migration from Red Hat 4 to Red Hat 5.

Here is some hard evidence. We recently started using the neat 'cron' feature in Condor to make a daily observation of the operating system version, kernel version, and C library version of each machine. With a few variations on condor_status, we can see the upgrade status of the whole system:

The major release numbers (below) aren't too bad. About 3/4 of our cores are running the latest Red Hat, but another 73 machines are behind by a version or two. And, oops, looks like someone plugged in their own personal CentOS machine. Not too hard to deal with, if you are careful to put 'redhat_version' in your requirements:


% condor_status -format "%s\n" redhat_version | sort | uniq -c | sort -rn

782 Red Hat Enterprise Linux Server release 5.4 (Tikanga)
27 Red Hat Enterprise Linux AS release 4 (Nahant Update 7)
26 Red Hat Enterprise Linux Server release 5.3 (Tikanga)
10 Red Hat Enterprise Linux AS release 4 (Nahant Update 8)
10 Red Hat Enterprise Linux WS release 4 (Nahant Update 7)
4 CentOS release 5.3 (Final)


If we go a little deeper, the picture gets murkier. Below are the distribution of Linux kernel versions. Interesting to note that a few are hand-modified for some unusual hardware, and only two are Xen virtualized. Hope that you don't have any code sensitive to the kernel version.


% condor_status -format "%s\n" kernel_version | sort | uniq -c | sort -rn

342 2.6.18-164.9.1.el5
294 2.6.18-164.el5
94 2.6.18-164.10.1.el5
32 2.6.18-164.11.1.el5
32 2.6.9-78.0.13.ELsmp
14 2.6.18-128.7.1.el5
12 2.6.18-164.6.1.el5
10 2.6.18-128.2.1.el5
6 2.6.18-164.2.1.el5
5 2.6.9-78.0.17.ELsmp
4 2.6.27.8-md-microway
4 2.6.9-89.0.20.ELsmp
2 2.6.18-128.4.1.el5
2 2.6.18-164.9.1.el5xen
2 2.6.9-78.0.5.ELsmp
2 2.6.9-89.0.16.ELsmp
2 2.6.9-89.0.9.ELsmp


For completeness, here is the distribution of glibc versions, which has much the same story:


% condor_status -format "%s\n" glibc_version | sort | uniq -c

452 glibc-2.5-42.el5_4.2
296 glibc-2.5-42
34 glibc-2.5-42.el5_4.3
24 glibc-2.3.4-2.41
16 glibc-2.5-34.el5_3.1
14 glibc-2.5-34
13 glibc-2.3.4-2.41.el4_7.1
6 glibc-2.3.4-2.43
4 glibc-2.3.4-2.43.el4_8.1


In the good old days, you could just indicate that a program required OpSys=="LINUX" and more or less expect it to run. That certainly isn't possible now. Perhaps we are misleading users by talking about this thing called Linux, which doesn't really exist in any consistent form. Instead, we should be telling our users that a new operating system gets invented every week, and is usually named after a team on Survivor.

The good folks at Sun tried to solve this problem almost 20 years ago with Java. The idea was that they would create a stable platform that could be implemented on any machine. Then, you could write programs that would be universally portable. The problem was, well...


% condor_status -format "%s " JavaVendor -format "%s\n" JavaVersion | sort | uniq -c | sort -rn
308 Sun Microsystems Inc. 1.6.0
222 Sun Microsystems Inc. 1.6.0_15
174 Sun Microsystems Inc. 1.6.0_17
52 Free Software Foundation, Inc. 1.4.2
28 Sun Microsystems Inc. 1.6.0_18
3 Sun Microsystems Inc. 1.5.0_17
2 Apple Computer, Inc. 1.5.0_19


Many people think the grand solution to this problem is virtual machines. Perhaps, but more on that next time.

Monday, January 11, 2010

Green Cloud Online

The Green Cloud is now online!

The Green Cloud is the invention of Dr. Paul Brenner at the ND Center for Research Computing. It is a containerized data center located at the South Bend city greenhouse, stocked with used servers kindly donated by Ebay, Inc. The first batch of machines was installed in December, and will eventually reach about 400 cores once everything is turned on.


What makes the data center unique is that is has no air conditioning. Instead, the data center takes in ambient air, and then exhausts it into the greenhouse. This benefits Notre Dame, since we no longer pay the cost of cooling, but it also benefits the greenhouse, which has significant heating costs during the winter months. (We used to call this idea grid heating.)

Of course, this means the capacity of the system may change with the weather. During the winter, the system can run at full blast and deliver as much heat as possible to the greenhouse. During the spring and fall, the heat may not be needed, and can be vented outdoors. During the hottest part of the summer, we may need to shut some machines down to get the temperature under control. However, recent studies by big data center operators suggest that machine temperature could be safely increased to 80 or 90 degrees, so there may be a fair amount of headroom available. We will see.

For a normal data center that runs web servers and databases, shutting down machines is not really an option. However, the Green Cloud provides fungible computing power for large computations in science and engineering at Notre Dame. If structured correctly, these workloads can adapt to 10 or 100 or 1000 cores. So, turning machines on and off will affect performance, but not correctness.

A good example of a flexible workload is genome assembly. Two of our students, Christopher Moretti and Michael Olson presented initial results on a Scalable Genome Assembler at the MTAGS Workshop held at Supercomputing 2009. Their assembler uses our Work Queue framework to manage a variable workforce, pushing out sequence fragments to whatever machines are available. The system has scaled up to about 1000 cores, spread across the Notre Dame campus, the Green Cloud, Purdue University, and the University of Wisconsin.

We are currently working on a journal paper and an open source release of the assembler, so stay tuned for details.

Thursday, October 1, 2009

Partly Cloudy with a Chance of Condor

We have been thinking about cloud computing quite a bit over the last month. As I noted earlier, cloud computing is hardly a new idea, but it does add a few new twists on some old concepts in distributed systems. So, we are spending some time to understand how we can take our existing big applications and make them work with cloud systems and software. It should come as no surprise that there are a number of ways to use Condor to harness clouds for big applications.
Two weeks ago, I gave a talk titled Science in the Clouds at an NSF workshop on Cloud Computing and the Geosciences. One of the points that I made was that although clouds make it easy to allocate new machines that have exactly the environment you want, they don't solve the problem of work management. That is, if you have one million tasks to do, how do you reliably distribute them between your workstation, your campus computer center, and your cloud workforce? For this, you need some kind of job execution system, which is largely what grid computing has focused on:

As it stands, Condor is pretty good at managing work across multiple different kinds of systems. In fact, today you can go to a commercial service like Cycle Computing, who can build an on-demand Condor pool by allocating machines from Amazon:


Just today, we hosted Dhruba Borthakur at Notre Dame. Dhruba is the project lead for the open source Apache Hadoop system. We are cooking up some neat ways for Condor and Hadoop to play together. As a first step, one of my students Peter Bui has cooked up a module for Parrot that talks to HDFS, the Hadoop file system. This allows any Unix program -- not just Java -- talk to HDFS, without requiring the kernel configuration and other headaches of using FUSE. Then, you can submit your jobs into a Condor pool and allow them to access data in HDFS as if it were a local file system. The next step is to co-locate the Condor jobs with the Hadoop data that they want to access.
Finally, if you are interested in cloud computing, you should attend CCA09 - Cloud Computing and Applications - to be held in Chicago on October 20th. This will be a focused, one day meeting with speakers from industry, academia who are both building and using cloud computers.

Monday, August 3, 2009

REU Project: BXGrid

This post continues last week's subject of summer REU projects.

Rachel Witty and Kameron Srimoungchanh worked on BXGrid, our web portal and computing system for biometrics research. This project is a collaboration between the Cooperative Computing Lab and the Computer Vision Research Lab at Notre Dame. Hoang Bui is the lead graduate student on the project. Rachel and Kameron added a bunch of new capabilities to the system; I'll show three examples today.

The first is the ability to handle 3-D face scans taken by a specialized camera equipped with a laser rangefinder. The still picture here doesn't quite do it justice, because each white "mask" on the left is a rotating animation of the face. By integrating this data into BXGrid, the 3-D data can be validated against previous ordinary images of the face.

I previously discussed All-Pairs problems, which are common in biometrics. While we already had the ability to run very large All-Pairs, problems, we never had the capability to view the results easily. Now, with the click of a button, you can set up a small All-Pairs problem and view the results on the portal:


Currently, new data ingested into the system is validated manually by people who must visually check that a eye, face, or whatever matches existing data in the system. Although this can be divided up among a large team of people, it is still time consuming and error prone.

Kameron and Rachel built a system that does a first pass at this task automatically. Using Makeflow, they set up a system to export all newly ingested images along with five good images that should match. This results in thousands of jobs sent to our Condor pool, which transform and compare the images. When all the results come back, you get a nice web page that summarizes the images and the results:


This research was supported in part by the National Science Foundation via grant NSF-CCF-0621434.

Tuesday, July 28, 2009

REU Project: Biocompute

This summer, we hosted four REU students who contributed to two web portals for distributed computing: Biocompute and BXGrid. I'll write about one this week and the other next week.

REU students Ryan Jansen and Joey Rich worked with recent grad Rory Carmichael on Biocompute, our web portal and computing system for bioinformatics research. Biocompute was originally created by Patrick Braga-Henebry for his B.S. honors thesis, and we are now putting it into production in collaboration with the Bioinformatics Core Facility at Notre Dame.

Biocompute allows researchers at Notre Dame to run standard bioinformatics tools like BLAST, and then share and manage the results. The new twist is that we transparently parallelize the tasks and run them on our campus Condor pool. This allows people to run tasks that were previously impossible: we routinely run workloads that would take months on a single machine, but get completed in hours on Biocompute.

The user simply fills out a form specifying the query, genomic databases, and so forth:

Biocompute transforms the request into a large Makeflow job that looks like this:


Users and administrators can view the progress of each job:


When the task is complete, you can browse the results, download them, or feed them into another tool on the web site:

This work was sponsored in part by the Bioinformatics Core Facility and the National Science Foundation under grant NSF-06-43229.

Friday, July 3, 2009

Make as an Abstraction for Distributed Computing

In previous articles, I have introduced the idea of abstractions for distributed computing. An abstraction is a way of specifying a large amount of work in a way that makes it possible to be distributed across a large computing system. All of the abstractions I have discussed so far have a compact, regular structure.


However, many people have large workloads that do not have a regular structure. They may have one program that generates three output files, each consumed by another program, and then joined back together. You can think of these workloads as a directed graph of processes and files, like the figure to the right.

If each of these programs may run for a long time, then you need a workflow engine that will keep track of the state of the graph, submit the jobs for execution, and deal with failures. There exist a number of workflow engines today, but without naming names, they aren't exactly easy to use. The workflow designer has to write a whole lot of batch scripts, or XML, or learn a rather complicated language to put it all together.

We recently wondered if there was a simpler way to accomplish this, A good workflow language should make it easy to do simple things, and at least obvious (if not easy) how to specify complex things. For implementation reasons, a workflow language needs to clearly state the data needs of an application: if we know in advance that program A needs file X, then we can deliver it efficiently before A begins executing. If possible, it shouldn't require the user to know anything about the underlying batch or grid systems.

After scratching our heads for a while, we finally came to the conclusion that good old Make is an attractive worfklow language. It is very compact, it states data dependencies nicely, and lots of people already know it. So, we have built a workflow system called Makeflow, which takes Makefiles, and runs them on parallel and distributed systems. Using Makeflow, you can take a very large workflow and run it on your local workstation, a single 32-core server, or a 1000-node Condor pool.

What makes Makeflow different from previous distributed makes is that is does not rely on a distributed file system. Instead, it uses the dependency information already present in the Makefile to send data to remote jobs. For example, if you have a rule like this:

output.data final.state : input.data mysim.exe
./mysim.exe -temp 325 input.data


then Makeflow will ensure that the input files input.data and mysim.exe are placed at the worker node before running mysim.exe. Afterwards, Makeflow brings the output files back to the initiator.

Because of this property, you don't need a data center in order to run a Makeflow. We provide a simple process called worker that you can run on your desktop, your laptop, or any other old computers you have lying around. The workers call home to Makeflow, which coordinates the execution on whatever machines you have available.


You can download and try out Makeflow yourself from the CCL web site.

Tuesday, June 2, 2009

Grid Heating: Putting Data Center Heat to Productive Use

Dr. Paul Brenner, a research scientist in the Computing Research Center at the University Notre Dame, has been advocating a novel idea called grid heating. He recently won a "Green IT Award" from the Uptime Institute for his work. Here is a short introduction to the idea:

Around the world, large data centers consume enormous amounts of power. In addition to the energy needed to spin disks and rearrange electrons, an approximately equal amount of power is needed to run the air conditioners and fans to remove that heat from the data center. In this sense, data centers are doubly inefficient, because they are using power to both heat and cool the same space. If we could put that heat to productive use, then we could save energy on cooling the data center, as well as save energy that would have otherwise been used to generate heat.


Last year. Dr. Brenner constructed a prototype of this idea at the city greenhouse in South Bend, which was struggling with enormous heating bills during the winter. He constructed a small cluster, and placed it in the Arizona Desert display in the greenhouse, where the plants need the highest temperature. Notre Dame paid the electricity bill, the greenhouse got the benefit of the heat, and the computers simply joined our campus Condor pool. Everybody wins, and nobody has to pay an air conditioning bill.


However, the first cluster was just a prototype, and couldn't generate nearly enough heat for the entire greenhouse. So, this year, Dr. Brenner is building a small data center in a modular shipping container. next to the greenhouse. With a new electricity and network hookup, the data center will run several hundred CPUs, and function as a secondary furnace for the facility, hopefully reducing the heating bill by half over the winter.


The new facility will significantly add to our campus grid, and will also give us some interesting scheduling problems to work on. The greenhouse needs heat the most during the winter, and to a lesser extent during the summer, so the computing capacity of the system will change with the seasons. Further, the price of electricity varies significantly during the day, so jobs run in the dead of night may be cheaper than those run during the day. If we can connect our "campus grid" to the "smart electric grid", we can make the system automatically schedule around these constraints.

Here are some recent articles about Grid Heating:

Wednesday, January 14, 2009

Audit Trails in Voting Machines

Kim Zetter at Wired magazine recently wrote about the use of log files in electronic voting machines. (It actually shows snippets of the relevant data, which is a refreshing use of primary evidence in journalism.) The article illustrates an often overlooked rule of software engineering:

A DEBUG FILE IS NOT THE SAME THING AS AN AUDIT TRAIL.

Here is my rough guess at what happened: Political forces informed the software company that the voting machines must produce an audit trail. Management instructed the programmers to produce a log file of some kind. The programmers already had some debug log files, so they added a few more printfs, and everyone seemed happy.

As Ms. Zetter explains, election officials attempted to read the audit trail and discovered it was essentially useless. Events were recorded in inconsistent ways. Items were incompletely specified, so the reader couldn't distinguish between deck zero on ballot A and deck zero on ballot B. Data in some messages is just plain wrong. Uncommon but expected events are recorded with scary messages like "Exception!" or "Lost deck!"

The problem is that the programmers created a debug file instead of creating a distinct audit trail. A debug file is a handy tool for recording messages during development. Debug messages are added haphazardly to the code as the programmer works to create and debug tricky bits of code. They are often cryptic or personal, because they are only intended to be read by the person that wrote them. For example, here is a bit of a debug log from the Condor distributed system. Note that ZKM is one of the programmer's names, who put his initials in to make it easy to find his own messages.

1/7 19:42:12 (89102.0) (9319): in pseudo_job_exit: status=0,reason=100
1/7 19:42:12 (89102.0) (9319): rval = 0, errno = 25
1/7 19:42:12 (89102.0) (9319): Shadow: do_REMOTE_syscall returned less than 0
1/7 19:42:12 (89102.0) (9319): ZKM: setting default map to (null)
1/7 19:42:12 (89102.0) (9319): Job 89102.0 terminated: exited with status 0
1/7 19:42:12 (89102.0) (9319): **** condor_shadow (condor_SHADOW) EXITING WITH STATUS 100

An audit trail is something completely different. It communicates to a third party some essential property of the system, such as number of users served, tax forms in progress, or ballots submitted. If you are creating an audit trail, you must add carefully crafted audit statements to the code in strategic places. Someone other than the programmer is going to read it, so it must be clear, concise, and consistent.

For example, the following is an audit log for users logging in and out of a standard Linux machine:

dthain pts/2 Tue Jan 13 20:56 - 21:23 (00:26)
dthain pts/2 Tue Jan 13 12:53 - 16:22 (03:29)
dthain pts/1 Tue Jan 13 12:52 still logged in

To summarize, a debugging file usually:
  • has an ad-hoc format to facilitate human consumption.
  • omits normal events and reports unusual or unexpected events.
  • does not completely describe the state of the system.
but an audit trail must:

  • have a well defined format that facilitates automatic analysis.
  • record every essential event in the system, whether normal or abnormal.
  • completely describe the essential state of the system at any time.
Now, we may interpret the problem with the voting machines in two different ways.

First, there is an language problem. Political forces used the term "audit trail", but at some step in communication, this was corrupted to "log file". Perhaps the programmers observed that they had a debug file, added a few more printfs, and assumed that the requirement was satisfied. You can see how this accident might have been made in good faith.

Second, there is a serious oversight problem. The purpose of an audit trail is to allow a third party to read the output and draw conclusions about the system. If we only discover that the audit trail is useless after the election, we can only conclude that nobody looked it during testing. If the project managers and their political overseers had demanded to see the so-called audit trail during testing, the entire problem would have been avoided.

So, the two morals of the story for computer programmers are:

  • A debug file is not the same thing as an audit trail.
  • Always double check that you got exactly what you asked for.

Thursday, December 11, 2008

Abstractions, Grids, and Clouds at IEEE e-Science 2008

I just attended the IEEE conference on e-Science in Indianapolis, and gave this talk on harnessing distributed systems with high level abstractions.

Another highlight of the conference was Rich Wolski's talk on Eucalyptus, an open source toolkit for cloud computing. Like Nimbus, it is API compatible with Amazon's EC2. That is, if your code works with Amazon, you can install Nimbus or Eucalyptus on your on cluster and run your own cloud.

Rich also spoke on the distinction between clouds and grids, which to many are the same idea. However, he pointed out a very important distinction:

- Clouds provide a resource allocation service. You ask for a certain number of machines, you get them for a certain amount of time, and you can choose to use them however you like. This gives you guaranteed service, which is great if you are running a web server, but can lead to underutilization if your goal is to run a large number of simulations.

- Grids provide a task execution service. You submit work to be executed, and the system decides where and when to execute the tasks, perhaps preempting or migrating them along the way. You have no guarantees of service, but the system will get very high utilization, making it good for high throughput computing.

As such, you can combine the two ideas together. For example, Cycle Computing provides a value added web service that employs both Amazon and Condor. You request a certain number of CPUs to execute a certain number of tasks. Cycle allocates the CPUs using Amazon, installs Condor on the nodes, and then runs the jobs. The result is a grid running on a cloud.

Tuesday, December 9, 2008

Visualizing Clusters in Real Time

The end of the semester is nearing, so activity in our distributed system really shoots up as undergraduates finish their semester projects and graduate students hurry to generate those last few research results. You can see this activity reflected in a number of visual displays that we have created to track activity in the system.

For example, the following is a snapshot of an applet that displays the current state of all machines in our Chirp storage cluster. Each machine is represented by a box, where colors indicate resources on each machine (memory, disk, cpu), and arrows indicate active network transfers. You can click on the following snapshot, or view the current live display if you like.


With a quick view, you can see four different things going on. Two students are working on their semester project in distributed systems, which is to create a dynamic cloud of web servers. This is reflected in the spread of network transfers going from two submit machines near the top, transmitting web server data to the hosts where they happen to run. One student is running a large All-Pairs job: this is reflected in the small vertical arrows about one third of the way down, indicating heavy disk traffic local to each machine. Closer to the bottom, someone is keeping the CPUs busy on the cluster named sc0-xx: this cluster runs Hadoop, so it is probably a Map-Reduce job.
Of course, this kind of display is only good for the high level immediate picture. It only tells you what is going on in the last minute. For a more historical view, we track and publish data from our Condor distributed batch system. For example, this shows the CPU utilization of our system over the last week. The red part shows the number of CPUs in use by the person at the keyboard, the green part shows the number of CPUs idle, and the blue part shows the idle CPUs harnessed by Condor. As you can tell, things picked up in the middle of the week:


This display shows the total CPU time consumed by different users over the last year. A few students have really racked up a lot of computation!


All of these displays rotate automatically on our "scoreboard", which is a monitor in a public hallway of the Engineering building at Notre Dame. It's not unusual for me to step out of my office only to find a few students checking to see who scored the highest over the last week! We ought to give a yearly award for the students who makes the best use of the system.

On a more philosophical note, the displays really help to make our work more concrete to outsiders. Because we work with intangible software instead of test tubes or fissile material, we don't have a "lab" to show visitors or prospective students. A live picture draws people in: random people from other departments stop in the hallway to look at the scoreboard and ask what is going on. A little effort put into "advertising" goes a long way.

Thursday, November 13, 2008

The Wavefront Abstraction

This is the third in a series of posts on the idea of abstractions for distributed computing on clusters, clouds, and grids. An abstraction is a simple interface that allows you to scale up well-structured problems to run on hundreds or thousands of computers at once.

The Wavefront abstraction came up in a discussion with several economists. You want to compute a recurrence relation where each result depends on one or more previous results. The user provides initial conditions along the edges of a matrix, and then you can compute F at position (1,1). Once you do that, then you can compute F at (1,2) and (2,1), and so on. The work progresses like a wave across the matrix, hence the name Wavefront. Here is what it looks like:


We have a first implementation of this abstraction that can run on a Condor pool of multicore machines. You simply run it by stating the function, size of the matrix, and providing some files that state the initial conditions:


wavefront func.exe 100 100


This abstraction is interesting for several reasons. First, it needs a variable number of CPUs over time. Even if you had an infinite number of CPUs, it can only use one in the first step, two in the second, and so on until the wavefront reaches the diagonal of the matrix, after which it decreases again. So, it would be impossible to program this efficiently in a system like MPI where you have to choose a fixed number of CPUs. Instead, you want to allocate more CPUs over time. For example, here is a timeline of a Wavefront run on a 64-CPU cluster. The red line shows the number of CPUs in use, and the green line shows the percent of the problem completed:


Second, the problem has a certain degree of asychrony built in. You do not need to run each diagonal slice of the system in lock step. Instead, each cell can be computed as soon as its neighbors are down. Because of this, different parts of the problem can be delegated to different nodes, allowing them to run and finish at their own pace. If each function is fast, then you can delegate an entire square chunk of the task to a remote processor, and allow it to complete independently.

You can see this in the progress images generated by our implementation of Wavefront. These images shows the state of a workload. Green boxes indicated completed cells, blue indicate cells currently running, yellow are ready to run, and red are not able to run. This is an example of a 10x10 Wavefront running on only five processors:


You can read more about the Wavefront abstraction at the Cooperative Computing Lab.

Friday, October 31, 2008

An Abstraction for Ensemble Classifiers

In the last post, I presented the idea of abstractions for distributed computing, and explained the All-Pairs abstraction, which represents a very large Cartesian product. Of course, a single abstraction is meant to address a very focused kind of workload. If you have a different category of problem, then you need another abstraction.

We discovered another abstraction while working with Nitesh Chawla's data mining group, also at Notre Dame. A common construction in data mining is the ensemble classifer. A single classifier examines the properties of a large number of objects and divides them up into groups that are roughly similar. You may be familiar with algorithms such as K-Nearest-Neighbors or Decision Trees. Improvements upon these algorithms continue to be an active area of research.

For any given classifier, you can often improve the runtime or the accuracy of the classification by breaking the data into pieces, running the classifier on each piece, and then collecting all of the results, using a majority vote to determine the final classification. For very large datasets, you may even need to use multiple processors and disks to complete the job in a reasonable amount of time.

To address this problem, our students Chris Moretti and Karsten Steinhauser created the Classify abstraction:

Classify( T, R, P, N, F ):
T - The testing set of data to classify.
R - The training set used to train each classifier.
P - The method of partitioning the data.
N - The number of classifiers to employ.
F - The classifier function to use.

Here is a schematic of the Classify abstraction:

This abstraction was also implemented on our local Condor pool and Chirp storage cluster, using one CPU and disk for each classifier function. With this implementation, Chris and Karsten were able to evaluate a number of classifier functions on multi-gigabyte datasets, using up to 128 CPUs simultaneously. In a week, they were able to accomplish what might have taken years to organize and execute by hand. You can read more about the technical details in our paper which will be presented at the International Conference on Data Mining.

The observant reader may notice that the Classify abstraction looks a lot like the Map-Reduce abstraction implemented in the Hadoop. In the next post, I'll discuss this similarity and explain the important difference between the two abstractions.

Wednesday, October 22, 2008

Abstractions for Distributed Computing

My current research revolves around the idea of abstractions for distributed computing. An abstraction is a way of simplifying a workload that runs on thousands of machines, in much the same way that a high level language simplifies the tiresome process of programming in assembly language. Let me explain a little more.

Real assembly language has operations like this:

  • MOV memory to register
  • PUSH register to stack
  • CALL procedure

As you may know, programming in assembly language stinks. The programmer has to keep track of the limited number of registers in use, the current state of the stack, and the meaning of external memory locations. If that's not enough, you have to worry about the behavior of instructions that have wildly varying runtimes, unusual exceptions, and sometimes asynchronous behavior.

We find much the same story in distributed computing, where the operations are something like:

  • TransferFile( source, destination );
  • ExecuteJob( executable, input, output );
  • AllocateVM( cpu, mem, disk, time );

If this is your instruction set, then you have many of the same problems. You have to manage a limited amount of local and remote storage, carefully cleaning up when jobs complete. If that's not enough, you have to worry about the behavior of instructions that have wildly varying runtimes, unusual exceptions, and sometimes asynchronous behavior. Sound familiar?

So, we advocate that users should employ high level abstractions that hide many of these ugly details, allowing the user to focus on the big picture. An abstraction expresses a pattern of computation that is simple, but may be very large, and thus requires significant effort to implement correctly and efficiently.

Chris Moretti is working on one abstraction called AllPairs. This abstraction crops up in a variety of domains, including biology, bioinformatics, and data mining, to name a few. It is easily stated:

AllPairs( set A, set B, function F ) returns matrix M
where M[i,j] = F( A[i],B[j] );

Of course, AllPairs is easy to execute on a small problem: just write a nested loop. But, what if sets A and B have 10,000 elements of 1MB each, and the function F takes ten seconds to run? You would be looking at 100TB of I/O and 1157 days of computation.

Instead, you need to harness a distributed system such as Condor to split up the computation across hundreds of machines. But you can't just submit 100,000,000 jobs: the queueing system would fall over. You can't just blindly have each job access the data over the network: the file server would file over. Without some careful tuning, your task will run even more slowly than the sequential version. The larger the problem gets, the more you have to worry about.

Fortunately, if your program fits in the All-Pairs abstraction, then we have solved the problem for you. If your "sets" are a bunch of files in a directory and your "function" is a Unix program that compares two objects, then you can simply invoke this at the command line:

allpairs A B Func

In the background, the All-Pairs implementation will measure the size of the objects, test the runtime of the function, choose the resources to use, distribute the data to the nodes, deal with failures, and then clean up the system. The user only has to worry about the problem to solve, not the method of achieving it.

In short, by using an abstraction, we can guide our users to appropriate ways of solving problems, and get them results in a reasonable time. You can read more about this in our paper on All-Pairs presented at IPDPS in the spring.

In future posts, I'll elaborate on other abstractions that we are designing and implementing.