Check out the new
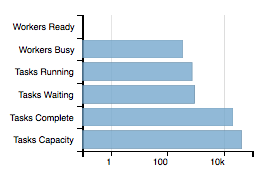
Work Queue Status page by Nate Kremer-Herman. This reveals a whole lot of information that was already reported to the global catalog in raw JSON, but was previously hard to interpret. For any WQ application reporting itself to the global catalog (use the -N option) you get a nice display of workers and tasks running and the total resources consumed across the application:


What's more, a pie chart shows a breakdown of the master is spending its time: sending data to workers, receiving data from workers, and polling (waiting) for workers to report are the main categories. This tells you at a glance what the bottleneck of the system is.
This WQ master is spending most of its time sending data out to workers, so it's close to the limit of its scalability:
However, this one is spending most of its time polling for results, and only a small fraction sending. It can likely handle many more workers:
This one is spending *all* of its time either receiving data from workers (completed tasks) or sending data to workers for new tasks. It is completely occupied: